SaaS-Metriken und KPIs
Was ist der Gesamtadressierbare Markt (TAM) für SaaS?
Was ist der Gesamtadressierbare Markt (TAM) für SaaS?
Der gesamte adressierbare Markt (TAM) ist der maximale Jahresumsatz, den ein SaaS-Unternehmen erzielen könnte, wenn es 100 % Marktanteil in seiner spezifischen Branche erreichen würde. Diese Berechnung schließt Variablen im Zusammenhang mit Wettbewerb oder Einschränkungen bei der geografischen und logistischen Verteilung aus.
Warum ist TAM entscheidend für das SaaS-Produktmanagement?
Für SaaS-Führungskräfte dient der TAM als Referenzpunkt bei der Produktplanung. Er hilft Produktmanagern zu beurteilen, ob ein Markt groß genug ist, um die Vorabkosten für Softwareentwicklung und Kundenakquise zu tragen.
- Investitionsbegründung: Venture-Capital-Geber nutzen den TAM, um zu beurteilen, ob ein Startup “Einhorn”-Potenzial hat (eine Bewertung von über 1 Milliarde US-Dollar).
- Roadmap-Priorisierung: Es hilft Teams zu entscheiden, ob sie Funktionen für eine breite Nutzerbasis oder eine spezifische Marktnische entwickeln sollen.
- Zielsetzung: TAM kann als Referenz für langfristige ARR (Annual Recurring Revenue)-Ziele dienen.
- Ressourcenallokation: Es informiert darüber, wie viel ein Unternehmen für Marketing ausgeben könnte, gemessen an der gesamten Marktchance.
Top-Down vs. Bottom-Up: Wie berechnet man das SaaS-TAM?
Es gibt drei Methoden zur Berechnung von SaaS TAM, die von makroökonomischen Branchenzahlen bis hin zu internen Kundendaten reichen.
1. Top-Down-Ansatz
Diese Methode nutzt Sekundärforschung von Firmen wie Gartner oder IDC. Man beginnt mit einer großen Branchenzahl und grenzt diese mittels Prozentangaben ein. Obwohl schnell, mangelt es ihr möglicherweise an der für die operative Skalierung benötigten Präzision.
2. Bottom-up-Ansatz
Dieser Ansatz verwendet interne Daten und eine einfache Kundenzählung. Er multipliziert den Average Selling Price (ASP) mit der Anzahl potenzieller Kunden ($TAM = ASP × n$). Das Ergebnis kann mit verfügbaren Aufzeichnungen und Umsatzannahmen abgeglichen werden.
3. Werttheorie-Ansatz
Dies wird für Produkte verwendet, die völlig neue Kategorien schaffen. Es schätzt den für den Nutzer geschaffenen Wert und den Anteil dieser „eingesparten Kosten“ oder „neuen Einnahmen“, den das Unternehmen durch die Preisgestaltung erzielen kann.
|
Methodik |
Anwendbar für |
Primäre Stärke |
Bekannte Einschränkung |
|
Top-Down |
Erste Pitch Decks |
Nutzt bestehende Branchenzahlen |
Zahlen stammen aus groben Branchenschätzungen und nicht aus verifizierten internen Daten |
|
Bottom-Up |
Strategische Planung |
Basiert auf internen Daten und überprüfbaren Kundendaten |
Eingeschränkt durch den Bedarf an granularen Daten |
|
Werttheorie |
Aufkommende Produktkategorien |
Erfasst “Zahlungsbereitschaft” |
Die Zahlen basieren auf Marktannahmen, wobei die entsprechenden Daten sich noch in einem frühen Stadium der Erfassung befinden. |
Wie nutzen SaaS-Unternehmen TAM für die strategische Planung?
SaaS-Unternehmen nutzen TAM oft als einen Input, wenn sie zwischen Wachstumsphasen wechseln (z.B. von einer “Build-it”- zu einer “Scale-it”-Phase). Durch die Analyse des Gesamtmarktes können Marketingteams Ziele für die Lead-Generierung festlegen, basierend auf der Anzahl der Konten, die sie erreichen können.
Praktische Anwendungen:
- Jährlich aktualisieren: Die Marktbedingungen ändern sich, daher sollte der TAM überprüft werden, um Preisaktualisierungen oder Inflation widerzuspiegeln.
- Gebietsplanung: TAM kann verwendet werden, um die Kundenverteilung über Regionen hinweg zu beschreiben.
- Gezieltes Marketing: TAM-Daten können verwendet werden, um digitale Anzeigen oder eine präzise Account-Based Marketing (ABM)-Strategie zu vergleichen.
- Skalierungsentscheidungen: Wenn der aktuelle Markt zu etwa 50 % gesättigt ist, können TAM-Daten die Planung für die Expansion in einen neuen geografischen oder vertikalen Markt unterstützen.
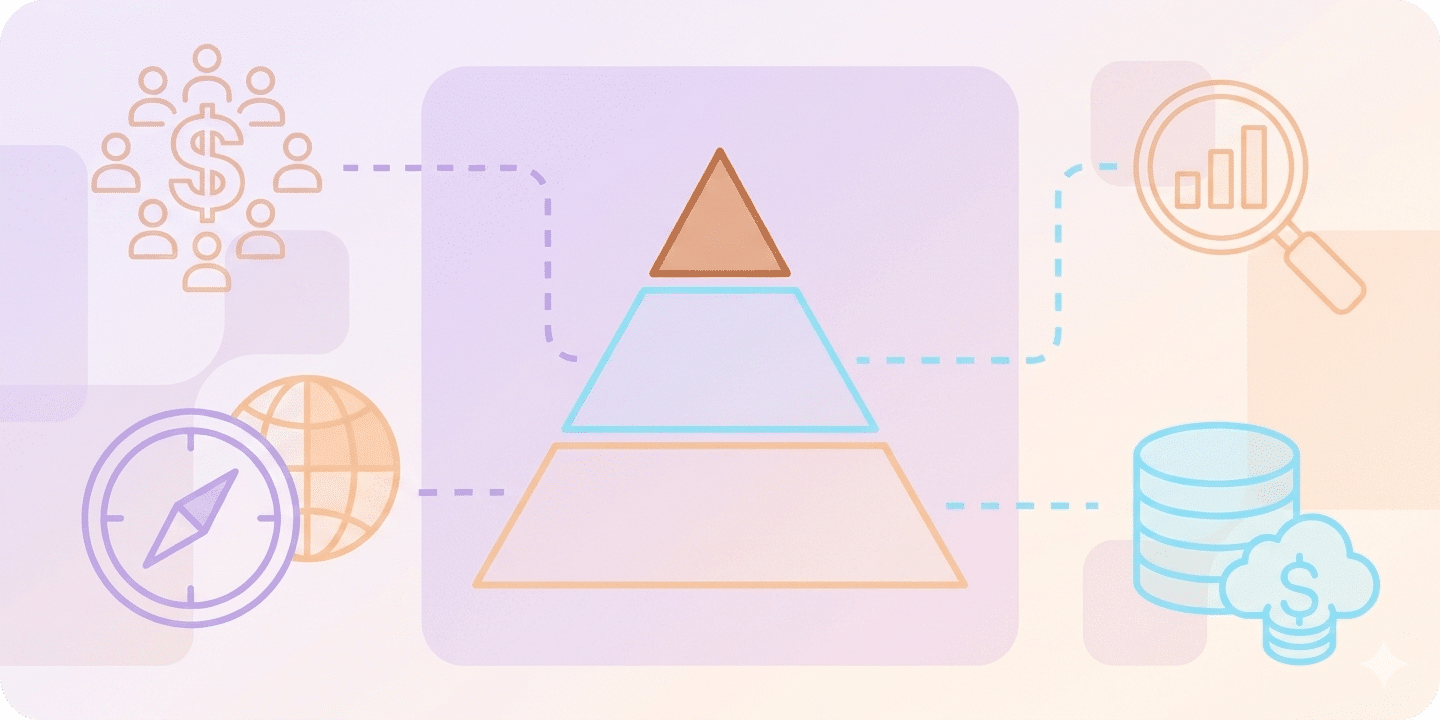
Die Hierarchie verstehen: TAM, SAM und SOM
Um TAM praktischer zu gestalten, kann es in kleinere Segmente unterteilt werden. Diese Stufen bieten Stakeholdern eine Möglichkeit, den aktuellen und längerfristigen Marktumfang zu vergleichen.
- TAM (Gesamt adressierbarer Markt): Die Gesamtnachfrage für Ihre Softwarekategorie.
- SAM (Bedienbarer verfügbarer Markt): Der Anteil von TAM, der Ihrer aktuellen geografischen Lage, Sprachunterstützung und technischen Anforderungen entspricht.
- SOM (Bedienbarer erreichbarer Markt): Der Anteil von SAM, den Sie basierend auf Ihrem aktuellen Verkaufsbudget innerhalb der nächsten 2–5 Jahre erreichen können.
Was sind häufige Fallstricke bei der SaaS-TAM-Berechnung?
Ein zu berücksichtigender Punkt ist die “1%-Fehlschluss,” was ein kleines Marktanteilsziel als leicht planbar darstellt, z.B. indem man glaubt, dass die Eroberung von “nur 1 %” eines 100-Milliarden-Dollar-Marktes ein einfacher Gewinn ist. Dabei werden Wettbewerb und Vertriebskosten nicht berücksichtigt, die Teil von Marktbewertung in überfüllten Softwarekategorien.
Wichtige Überlegungen:
- die Freemium Falle: Halten Sie Free-Tier-Nutzer getrennt, wenn Sie eine umsatzbasierte TAM-Berechnung erstellen.
- Statisches Denken: Die Marktbedingungen entwickeln sich im Laufe der Zeit, daher kann eine TAM-Berechnung aus dem Jahr 2022 von aktuellen KI-gesteuerten abweichen Prozessautomatisierung Trends.
- Regulierungsbarrieren: Schließen Sie Regionen aus, in denen Ihre Software nicht legal betrieben werden kann, wie z.B. Märkte, die von Datenresidenzregeln betroffen sind wie GDPR.
Schlussfolgerung
SaaS TAM ist eine Metrik, die sich auf den Marktumfang eines Produkts bezieht. Top-down- und Bottom-up-Ansätze, zusammen mit Überlegungen wie der “1% fallacy,”, gehören zu den Faktoren, die SaaS-Führungskräfte bei der Integration von Marktdaten und operativen Einschränkungen in ihren Planungsprozess berücksichtigen können.
Bereit anzufangen?

