

How to Do RFM Analysis for SaaS
To create a profile of a customer using Recency, Frequency, and Monetary values for a SaaS application, the accounting department should be equipped with information on the recent activities of the account. Many SaaS companies engage in the process of identifying churn factors through behavior analysis and subsequently adjusting contract value according to usage patterns.
This section will take you through the steps of building RFM scores, or more precisely, how to perform a segmentation and conversion process for at-risk accounts, and how to increase the number of high-value customers worldwide.
When giving this consideration, the strength of your team’s engineering and the availability of useful data also need to be factored in. You can get a reflection of your readiness by answering these four basic questions: Do you have clean transaction records from all the payment gateways? Is your product analytics system capable of tracking user events? Is your primary objective just to reduce churn or go to new markets? Is your team capable of implementing the manual SQL scripts or does it need a trigger?
The availability of technical resources influences the readiness for a real-time data pipeline. It is better to start with simple 3-tier spreadsheet segmentation on core accounts. On the other hand, if the system includes more than 1 million micro-transactions performed in different parts of the world, it is necessary to use scoring based on an API to keep the accuracy of the segments in place.
Thus, it is important to understand the limitations of the resources available for retention activities and to direct them only towards the retention of the revenue that is at stake in the immediate future. This way, you can avoid investing too much time and resources in activities that might not bring in immediate revenue.

Concept snapshot
-

Category: Customer Analytics and Revenue Operations
-

Used By: B2B SaaS platforms and startups
-

Primary Purpose: Segment accounts and reduce churn
-

Related Concepts: Customer Segmentation, Dunning Management, CLV
-

Stage in Growth:
Scaling and global expansion
Collect and Clean SaaS Usage Data
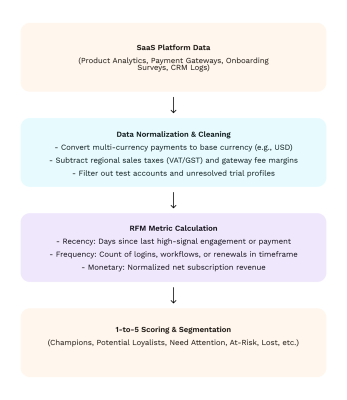
To create a database of customer activities, the information available from payment gateways, CRMs and product analytics tools should be pulled. The presence of incomplete information, duplicate records, test accounts, or unverified trial profiles within SaaS data may affect the precision of associated values.
Thus, it is necessary to clean the data to eliminate such practices and concentrate on the actual customer behavior that is generated by live accounts. However, before running any scoring scripts, the data are to be formatted consistently across all the tools in which they are integrated. Otherwise, it should be set up as a periodic process to avoid slowing down the system and to keep the reports accurate.
Data Collection Checklist
- Obtain product analysis logs (Mixpanel, Heap, or Amplitude) for account logins and feature execution events.
- Export payment records from the subscription billing process with the help of transaction dates, gross amounts, and currencies.
- Eliminate internal accounts, staging environments, and free trial accounts using a filter.
- Add a filter for external user IDs in CRM tools (HubSpot, Salesforce) and payment gateways to create one single account.
Isolating Recency and Frequency Metrics
In order to identify specific customer transaction dates (Recency) and renewal patterns (Frequency):
- Recency Calculation: Keep an eye on the exact time of the last action with high relevance—for example, a successful billing event, or login, or core process execution—rather than just passive browsing. Take away this date from the total number of days in the analysis and get the exact number of days.
The formula is: R = T(reference) – T(last_purchase)
- Frequency Calculation: Consider high value activities as a product of a single period, for example, 90 days for user activity or 12 to 36 months for enterprise contract renewals in the case of subscription software. For subscription software, count active seats or expansion conversations as parts of the period as a measure of real growth in the relationship.
Consider moving the focus of activity to recency in admins or workspace owners with respect to seat logs, rather than total seat logs. Accounts with regular end-user activity but inactive billing administrators for 60 days exhibit a pattern associated with elevated churn.
A Forrester report indicates that SaaS companies utilizing incremental automation with RFM segmentation observed a 9% upward change in their retention rate over a 6-month period.
A graphics and UI design SaaS like Figma tracks team workspace usage. A corporate workspace involves 15 designers who edit files on a daily basis. The primary billing administrator has remained inactive for a 75-day period. Using the Recency parameter of 75 days based on the admin’s activity triggers the account for proactive retention outreach in advance of the annual renewal date.
Free RFM Analysis Implementation Checklist for SaaS
Execute your SaaS RFM analysis to protect revenue and drive cross-border expansion.
-

Phase-by-phase implementation roadmap
-
SQL scoring templates and segment matrix
-
Automated dunning and revenue recovery strategies
-
Global expansion checkout checklist
Normalize Global Revenue for Monetary Scoring
To create an accurate “Monetary” score for the accounts based on the total amount of checkouts, including variable regional sales taxes (VAT/GST), currency conversion issues, and payment processing fees requires careful methodology. Comparisons of accounts using gross revenue, without adjusting for regional taxes, may result in differing assessments of value, given that $100 in Europe and $100 in the US can exhibit distinct profitability levels due to VAT. Foreign exchange rates have an impact on the total spending figures observed over the subscription period. Removing the fees generated by the platform gives way to the understanding of what the account is really making.
Consolidating all transactions into one currency for reporting purposes relates to the framework for positioning.
- Taxes and Fees: Locate any taxes, goods and services tax (GST), or payment processor fees attached to the gross transaction amount.
- Convert to Base Currency: Apply the foreign exchange (FX) rate taken from the currency converter at the time of the transaction to convert the local payment into the reporting currency (USD in this case).
- Calculate Net Contribution: Find the net revenue derived from an account using the method of taking the average rate from all the billing periods.
| Net Monetary Value = sum (Gross Amount – Taxes – Gateway Fees) x FX Rate(t) |
Revenue Normalization Comparison
| Account Location | Gross Transaction | Local Tax (VAT/GST) | Gateway Fee (3%) | Daily FX Rate | Normalized Net Value (USD) |
| United States | $100.00 USD | $0.00 | $3.00 | 1.00 | $97.00 |
| Germany | €100.00 EUR | €15.97 (19% VAT) | €3.00 | 1.08 | $87.51 |
| United Kingdom | £100.00 GBP | £16.67 (20% VAT) | £3.00 | 1.27 | $102.02 |
Data from a Gartner report suggests that 62% of SaaS companies’ non-application of behavioral segmentation is influenced by the lack of a comprehensive perspective on user behavior and preferences.
If a Paris-based mid-market company spends €1,000 monthly on a SaaS subscription, the gross receipt is €1,000. After deducting 20% French VAT (€166.67) and gateway processing fees (€30.00), the net revenue equals €803.33. Converted at an FX rate of 1.08 USD/EUR, the final net Monetary score equals $867.60.
PayPro Global performs the function of a Merchant of Record by taking care of SaaS sales tax, currency conversion, and fee aspects of the transaction at the point of sale. This allows your revenue reporting to be directed into your RFM model as clean, undistorted profits.
Free RFM Analysis Implementation Checklist for SaaS
Execute your SaaS RFM analysis to protect revenue and drive cross-border expansion.
-
Phase-by-phase implementation roadmap
-
SQL scoring templates and segment matrix
-
Automated dunning and revenue recovery strategies
-
Global expansion checkout checklist
Score Accounts and Define Segments
In order to convert the raw measurements of Recency, Frequency and Monetary values into a score, you should allocate scores between 1 and 5 for each of the components. Dividing the customer base into quintiles gives an opportunity to put 20% of the customers in bucket 5 and 20% in bucket 1 according to the performance rating. Obtaining such an aggregate result gives an RFM code that contains information on the account’s current stage in the lifecycle. With these codes, marketing campaigns can be formulated for specific recipient groups, differentiating from non-specific email communications.
Every 6 months, it is necessary to prepare such boundaries again to align the segments with the changing patterns of product usage.
RFM Segment Matrix:
| Segment | Score Pattern | Profile Characteristics | Recommended Action |
| Champions | High R (4-5), High F (4-5), High M (4-5) | Frequent activity, high net revenue, recent engagement. | Invite to advisory boards, offer early feature access, request case studies. |
| Potential Loyalists | High R (4-5), Moderate F (2-3), Variable M | Recent sign-ups or upgrades displaying steady usage growth. | Send targeted feature adoption guides and trigger secondary onboarding flows. |
| Need Attention | Moderate R (2-3), High F (4-5), High M (4-5) | Historically strong accounts showing recent drops in interaction. | Schedule executive health checks and review recent support ticket history. |
| At-Risk | Low R (1-2), Moderate F (2-3), High M (4-5) | High revenue contribution alongside declining frequency and recency. | Trigger re-engagement offers, adjust billing schedules, and route to account managers. |
| Lost | Low R (1), Low F (1), Low M (1-2) | Inactive usage, no recent renewals, lowest historical spend. | Run automated 3-question exit surveys and add to 6-month win-back sequences. |
In order to perform RFM analysis in SaaS applications or traditional databases, you have to prepare SQL queries to divide accounts into these predefined percentile ranks.
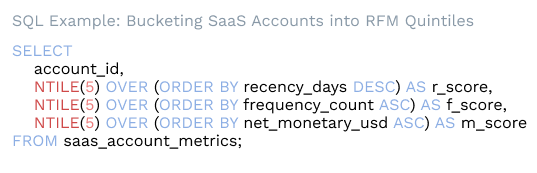
Start your project with the help of only three main groups—Champions, At Risk and Potential Loyalists—and then go for an 11-category model in the future. Early segmentation into numerous categories during marketing campaign planning may shift audience focus from primary objectives and can establish multiple avenues for promotion.
An interactive SEO tool like Ranktracker uses RFM analysis across free accounts and identifies 45 accounts with a ‘511’ score (High Recency, Low Frequency, Low Monetary). These are new sign-ups who logged in recently but haven’t adopted core features for monitoring keywords. An automated onboarding process that includes step-by-step guidance completes 30% of the defined stages for individuals to be categorized as “Potential Loyalists” within 30 days.
Free RFM Analysis Implementation Checklist for SaaS
Execute your SaaS RFM analysis to protect revenue and drive cross-border expansion.
-
Phase-by-phase implementation roadmap
-
SQL scoring templates and segment matrix
-
Automated dunning and revenue recovery strategies
-
Global expansion checkout checklist
Automate Billing and Dunning for At-Risk Segments
If a platform uses RFM segmentation for accounts and integrates it with billing policies, it may influence the management of dunning periods and the application of proactive discounts, which could relate to account retention. Accounts where Recency scores are falling can be associated with payment challenges, with expired cards or modified card management practices as potential influences. If retention strategies include changing the payment retry schedule, users will have more time to resolve the issue and avoid cutting off the service immediately.
Locating an option to enable payment methods specific to the region where the user is located or changing the subscription period temporarily can help in keeping accounts that are going through a process of redefining the budget. The direct connection of these triggers to the billing engine affects a platform’s revenue considerations and may influence the extent of manual selling required.
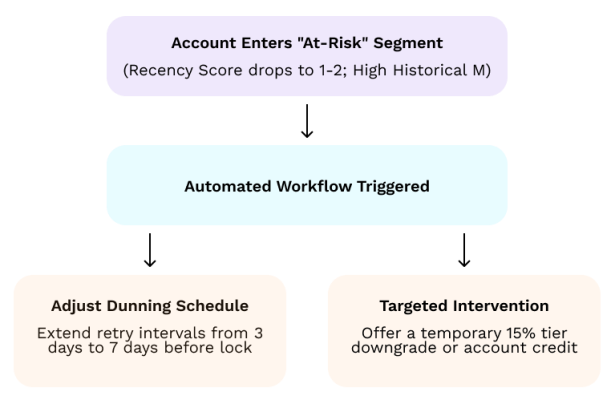
When an account reaches the “At-Risk” stage (e.g., score 155 or 244):
- Modify Dunning Sequences: Adjusting the dunning sequence to extend the retention attempt period from 3 days to 7 days provides account owners with a longer timeframe for updating expired card details before service termination.
- Apply In-App Credits or Discounts: Activate an administrative process using payment infrastructure tools to offer a 15% discount off the subscription or credit card payment with no notice that a payment has failed or reduced login activity.
- Route High-Value Alerts: Notify selected customers and success managers of an account with a Monetary score of 5 entering a low Recency tier within less than 10 minutes.
Integrate qualitative feedback collection with dunning activities that are already being performed mechanically. For example, if a user experiences a payment failure due to an expired card, triggering a micro-survey can help determine whether the non-payment reason is technical or financial.
Free RFM Analysis Implementation Checklist for SaaS
Execute your SaaS RFM analysis to protect revenue and drive cross-border expansion.
-
Phase-by-phase implementation roadmap
-
SQL scoring templates and segment matrix
-
Automated dunning and revenue recovery strategies
-
Global expansion checkout checklist
Expand High-Value Segments Internationally
The process of identifying users with the highest RFM score (“Champions“) and utilizing existing features to facilitate expansion into new territories or an increase in license numbers requires that you:
- Filter for Top Scores: Get your CRM or analytics tool and find accounts that have a 555 or 554 score in all the territories.
- Enable Localized Upgrades: Set the checkout processes to show local currencies on payment pages, preferred regional payment methods (for example, SEPA in Europe, iDEAL in the Netherlands, Alipay in APAC), and remove the taxes automatically if these accounts see up-selling opportunities.
- Prompt Expansion: Show case to individual accounts offers for more seats or enterprise editions based on the location and the usage patterns.
A hotel management software as far as MiniHotel provides 200 accounts in Europe as Persons of Interest that are based on the normal subscription. However, through the introduction of local Euro accounts with preferred local payment methods such as SEPA direct debit and iDEAL, the platform increases the upgrade conversion rate from an average of 2% to 11% within 90 days.
PayPro Global supports 70 payment methods and more than 140 currencies with localized checkout flows, which allow your sales team to convert high-end international prospects without the need to put in place custom payment integration.
Conclusion
A clear understanding of how to perform RFM analysis helps the SaaS team to transform the events logged by an application into useful user segments.
It is particularly useful to reduce the number of accounts that are at risk of leaving the fold by incorporating and harmonizing financial metrics and dividing them into groups according to the recency and frequency of their activities. The connection of these groups with billing workflows may influence churn metrics and the total value of agreements.
Every 3 months, it is necessary to prepare an update of the scoring parameters according to changes in the patterns of product usage, whether there are or not.
Ready to get started?
We’ve been where you are. Let’s share our 19 years of experience and make your global dreams a reality.

FAQ
-
E-commerce depends heavily on the dates of the transactions and the values of the orders, while B2B SaaS changes these metrics according to the subscription model. Recency emphasizes high-value activities (such as login or core process execution), instead of just visiting the website; Frequency focuses on repeated usage or expansion of the number of seats, and the Monetary score is based on normalized net recurring revenue.
-
As far as the time period is concerned, it should be taken into account that there are some aspects to consider when defining it. Recency normally refers to activity during the last 30 to 90 days, while Frequency and Monetary accounts should be based on 12 to 36 months of account activity, enough to capture renewals and expansion contracts once a year.
-
Scores need to be updated periodically, once a month at the conclusion of an active engagement or in real-time using a continuous feed. Regular re-evaluation of the score allows for the early detection of potential unfavorable trends, which may influence outcomes concerning annual contract renewals and associated turnover.
-
Unadjusted gross income incorporates taxes on goods and services prior to their sale, which influences its alignment with actual business profitability. The deduction of local VAT/GST and credit card processing fees from gross income establishes a context for managing collections, shifting the focus to net income at the conclusion of an accounting period, rather than figures based on gross income.
-
A start-up should avoid the temptation of dividing into too many segments in the first place and concentrate instead on creating categories for Champions, At Risk and Potential Loyalists. Early implementation of customer segmentation by a start-up can influence the scale of marketing expenditure. Directing efforts toward these three groups for retention and expansion often precedes a change in early performance metrics.
-
When an account reaches the “At-Risk” stage, automatic processes should include extending the time to collect the debt by 7 days and applying various promotional tools, such as discounts or credits, to win it back. The process includes generating alerts or transferring the matter to a higher-level customer success manager, potentially resulting in executive communication.
-
Focusing efforts on accounts identified as “Champions” that demonstrate positive performance may relate to changes in revenue through additional product incorporation or subscription upgrades. To boost your upgrades, you can consider incorporating localized checkout features such as local currencies, preferred regional payment methods (SEPA or iDEAL in this case), and taxes handled by software.


 English
  Español
  Português
  Português do Brasil
  Français
  Italiano
  Deutsch
  Nederlands
  Polski
  Română
  Українська
  简体中文
简体中文  日本語
日本語  한국어
한국어